Specialized articles
Analysis of Reciprocating Machines

Reciprocating engines and compressors can be diagnosed with high precision [...]
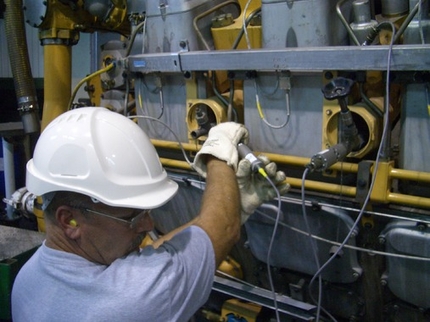
Reciprocating engines and compressors can be diagnosed with high precision based on dynamic pressure, ultrasonic, and vibration signals.
In piston compressors and internal combustion engines, vibration analysis using FFT is not an effective technique, since the vibration spectrum contains so many peaks that it is impossible to distinguish the various mechanical problems present.
The analysis of cylinder pressure traces is the fundamental technique in the predictive diagnosis of this type of machine. Cylinder pressure can be represented as a closed-loop curve plotted against the volume swept by the piston (P-V) or as an open-loop curve plotted against the crankshaft angle (P-a).
The P-V curve is used to calculate power (IHP) and perform a performance analysis of the machine, as a technique for evaluating its operating condition by comparing it to nominal or design parameters.
The open P-a curve is used for multichannel analysis of waveforms by superimposing typical mechanical condition variables (vibration and ultrasound) onto the cylinder pressure trace.
Typical diagnostic charts for reciprocating machines are:
- Pressure versus Cylinder Volume (P-V) Graph.
- Graph of Pressure versus Crankshaft Angle (P-a).
- Overlay of BF vibrations (0–200 Hz) on the (P-a) trace.
- Overlay of AF vibrations (1–20 kHz) on the (P-a) trace.
- Ultrasound graph (40–60 kHz) superimposed on the (P-a) trace.
- RPM Angular Kinematics Monitor (Torsional Vibration Analysis).
- FFT graph of pressure (pulsation analysis).
- Primary and Secondary Ignition Chart (in M.E.P.).
Related Products
Prognost Advanced Monitoring System for Reciprocating Compressors
Contact one of our engineers specializing in predictive maintenance for advice on how to implement predictive maintenance through the analysis of alternative machines: info@preditec.com